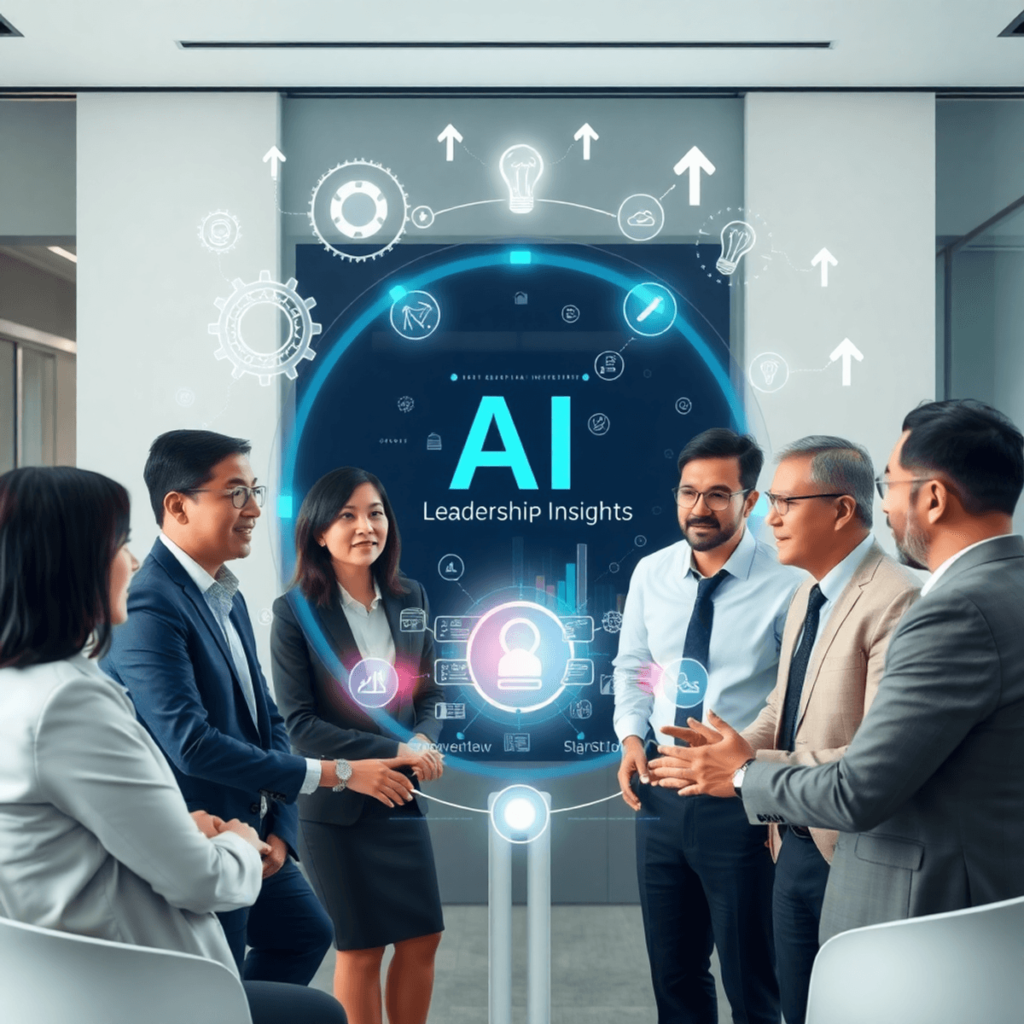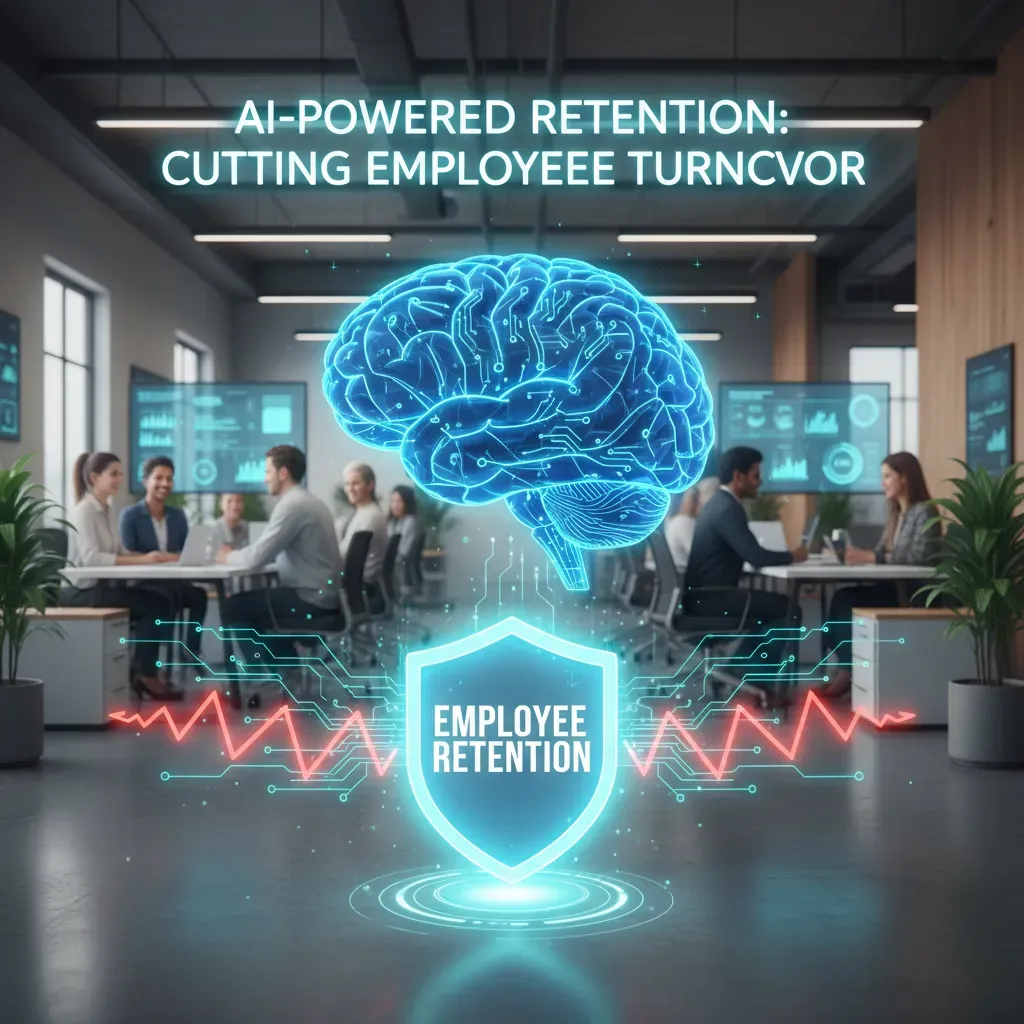
I still remember the quarter we lost a string of senior people in six weeks — hiring took months and knowledge vanished overnight. That experience taught me to stop guessing and start measuring. In this post I walk you through pragmatic, data-driven retention strategies powered by AI, mixing research, practical examples, and a few things I learned the hard way.
Why Turnover Costs More Than You Think
I learned this the hard way on a small product team. Within one quarter, we lost two senior engineers. On paper, it looked like “just” two resignations. In reality, it triggered a chain reaction: our release dates slipped, code reviews slowed down, and the rest of us started second-guessing priorities. Morale dipped because people felt like they were always covering gaps instead of building something new.
That experience is why I take Data-Driven Retention Strategies seriously. Turnover is not only an HR problem—it’s a business cost that spreads across the whole company.
The real replacement cost (it’s bigger than recruiting)
Most leaders see the visible costs first: job ads, recruiter fees, and interview time. But the hidden costs are usually larger. Depending on the role and seniority, replacing an employee can cost 50%–200% of their annual salary.
- Recruiting costs: sourcing, screening, interview panels, background checks, and agency fees.
- Lost productivity: work pauses, projects slow down, and teammates spend time filling in.
- Training and onboarding: ramp-up time, manager coaching, documentation updates, and mistakes that happen during learning.
- Quality and customer impact: delays, bugs, and missed commitments can affect trust and revenue.
The biggest cost of turnover is often the work that never happens while everyone is busy replacing the person who left.
Five business drivers for retention
When I frame retention as a business system, these drivers become clear:
- Cost savings: fewer backfills, less overtime, and lower recruiting spend.
- Knowledge retention: critical context stays in-house, especially on complex products.
- Competitiveness: stable teams ship faster and respond to the market with less friction.
- Sustainable growth: leaders can plan capacity instead of constantly resetting.
- Collaboration: trust and team rhythm improve when people aren’t always new.
Chart idea: visible vs hidden turnover costs
| Visible Costs | Hidden Costs |
| Recruiter fees, job ads, interview time | Lost output, delayed roadmap, lower morale, manager time, ramp-up errors |
A stacked bar chart can show how hidden costs often outweigh the visible line items for a departing employee.
Predictive Analytics and AI in HR: Turning Signals into Strategy
When I talk about predictive analytics in HR, I mean using patterns in our people data to make a smart forecast—especially around flight risk. Instead of waiting for a resignation letter, I look for signals that often show up weeks (or months) earlier: changes in engagement scores, short tenure in a role, a drop in manager ratings, fewer internal applications, or a sudden spike in absences. This is the heart of Data-Driven Retention Strategies: turning everyday HR data into clear actions.
How predictive analytics works (in plain language)
I treat it like a weather forecast. One data point rarely tells the full story, but several together can. For example, an employee with strong performance but falling engagement and a manager change may be at higher risk than someone with low engagement alone. AI helps by spotting these combinations faster than I can in spreadsheets.
A quick experiment I ran (anecdotal)
In one internal test, I used historical exit data and basic HR fields (tenure, engagement survey trends, manager rating changes, and role movement). I built a simple model to flag “at-risk” employees. It correctly identified future leavers with over 65% accuracy in that dataset. It wasn’t perfect—and it wasn’t meant to label people—but it was good enough to start better conversations and prioritize support.
“The goal isn’t to predict resignations to control people. It’s to predict risk so we can improve the work experience.”
Practical AI use cases I rely on
- Attrition modeling: scoring teams or roles by risk level so I know where to focus first.
- Skill gap detection: comparing current skills to future needs to reduce frustration and stagnation.
- Targeted interventions: recommending actions like manager coaching, workload review, or internal mobility options.
- Personalized development plans: suggesting learning paths based on role goals and employee interests.
Chart idea: AI adoption in HR through 2026
If I were adding a visual here, I’d include a simple line chart showing projected AI adoption in HR rising toward 2026, highlighting that 84% of talent leaders plan to use AI. It helps frame why predictive analytics is quickly becoming a standard part of retention planning—not a “nice to have.”

Revamp Onboarding and Performance Management to Lock in Talent
Why onboarding matters more than we think
When I look at early turnover, I usually find the same pattern: people leave because the first weeks feel confusing, lonely, or poorly planned. A strong onboarding process fixes that. In fact, Brandon Hall Group reports that a well-structured onboarding program can improve new-hire retention by 82%. For me, that number is a clear signal that onboarding is not “HR paperwork”—it is one of the most practical data-driven retention strategies we can use.
“Well-structured onboarding can improve new-hire retention by 82%.” — Brandon Hall Group
A practical onboarding checklist I use (and measure)
I like onboarding best when it is simple, repeatable, and tracked like any other business process. Here’s a checklist that works well, especially when supported by AI reminders and workflow tools:
- Pre-boarding schedule: send a 2-week plan before day one (tools, access, first meetings, key docs).
- First 90-day milestones: define what “good” looks like at 30/60/90 days (skills, projects, relationships).
- Buddy program: match each new hire with a peer buddy for quick questions and social support.
- Early feedback loops: run short check-ins at week 1, week 3, week 6, and day 90.
AI helps me keep this consistent. For example, it can flag missed milestones, summarize check-in notes, and spot patterns like “new hires in Team A report unclear priorities.” That turns onboarding into something I can improve with real data, not guesses.
Reimagine performance improvement plans with AI
Traditional PIPs often feel like generic warnings. I prefer AI-supported plans that are prescriptive: clear goals, specific behaviors, and weekly coaching steps. Instead of “improve communication,” I use goals like “send a daily project update by 3 PM” or “confirm requirements in writing before starting work.” AI can suggest development actions based on role expectations, past performance notes, and training options—while managers still make the final call.
Chart idea to include in this section
To show impact, I would add a simple before-and-after bar chart of turnover in the first 6 months:
| Period | Turnover (First 6 Months) |
| Before improved onboarding | __% |
| After improved onboarding | __% |
Flexible Work, Compensation, and Benefits: The New Retention Trifecta
When I look at turnover data, I keep seeing the same pattern: people don’t leave only because of one issue. They leave when work setup, pay, and benefits don’t match their real life. That’s why I treat flexible work, compensation, and benefits as a single retention system—and why AI helps me connect the dots faster.
Flexible work is no longer a “nice to have”
Flexible work is a direct retention lever. In fact, 64% of Americans would consider changing jobs if forced back full-time to the office. I use AI to spot where rigid office rules are creating risk—by team, role type, commute distance, and even manager patterns (like who approves flexibility and who doesn’t).
Then I focus on policies that are easy to explain and easy to measure:
- Hybrid schedules with clear in-office “anchor days”
- Compressed workweeks (like 4×10) for eligible roles
- Flexible hours with core collaboration windows
Benefits are a major decision driver
Compensation matters, but I’ve learned that benefits often decide the final “stay or go.” Nearly 6 in 10 employees cite benefits as the most important non-salary consideration. With AI, I can compare benefit usage and satisfaction signals (surveys, HR tickets, open enrollment questions) to predict where people feel unsupported—like high out-of-pocket healthcare costs or limited family leave.
Pay transparency reduces quiet frustration
Even strong benefits can’t fix pay confusion. One practical move I recommend is transparent compensation bands. AI can help benchmark roles, flag pay compression, and show where internal equity issues may trigger exits. I keep the message simple: “Here’s the range, here’s how growth happens, and here’s what performance looks like.”
Chart idea for this section
I’d include a pie chart showing common reasons employees leave:
- Rigid office mandates
- Pay
- Lack of benefits
- Career stagnation
Retention improves fastest when flexibility, pay, and benefits work together—not as separate programs.
Internal Mobility, Career Development, and Workforce Reskilling
When I look at why people leave, I often find the same root issue: they can’t see a future inside the company. That’s why internal mobility is one of the most practical data-driven retention strategies. It gives employees a clear path forward without forcing them to job-hop to grow.
Internal mobility is also becoming a business need, not just a “nice to have.” Redeployment needs will rise—one in five employees may need redeployment by 2030. If I can use AI to spot where roles are shrinking and where demand is growing, I can move people into new opportunities before they disengage.
How AI makes internal mobility easier
- Role matching: AI compares skills, past projects, and interests to open roles.
- Career path suggestions: It shows realistic next steps, not random job posts.
- Early signals: It flags teams with high burnout or low growth so I can offer moves sooner.
A simple reskilling blueprint I use
To make mobility real, I need reskilling that is structured and measurable. Here’s a blueprint that works:
- Skills audit: Build a clear inventory of current skills using self-assessments, manager input, and project history.
- AI-driven gap analysis: Compare today’s skills to future roles and identify the top gaps by team and person.
- Learning pathways: Create short, role-based tracks (for example: data basics → automation tools → applied AI in the workflow).
- Mentorship programs: Pair learners with internal experts so training turns into real performance.
I also keep expectations realistic: hiring AI talent at scale is unrealistic for most organizations. Competition is intense, costs are high, and the best candidates have options. That’s why I focus on building AI skills internally—upskilling analysts, HR partners, operations leads, and managers who already know our business.
Chart idea: bar chart of reskilling outcomes
If I were visualizing impact for leaders, I’d use a simple bar chart showing:
- Improved retention (higher internal moves, fewer exits)
- Reduced hiring costs (fewer external searches and agency fees)
- Faster redeployment (shorter time to fill roles internally)

Implementation Roadmap: Tools, Culture, and Measuring ROI
To make Data-Driven Retention Strategies work in real life, I follow a simple roadmap that turns AI insights into manager actions. I treat this as the closing phase of the program: moving from “interesting data” to measurable retention improvements.
Step-by-step plan I use
First, I audit data sources. I check what we already have in our HRIS (tenure, role changes, pay bands, attendance, performance notes) and what we can add safely (engagement surveys, exit interview themes, internal mobility history). I also confirm data quality and access rules so we protect privacy and avoid bias.
Second, I run a small pilot with predictive models. I start with one department or job family where turnover hurts the most. The goal is not a perfect model; it is a useful signal that helps leaders act earlier. I compare AI risk flags with what managers already know, then refine.
Third, I build retention playbooks. When the model flags risk, the response should be consistent: career path talk, workload review, manager coaching, pay review triggers, or a reskilling plan. This is where AI becomes practical.
Fourth, I train managers. I focus on how to have better 1:1s, how to document actions, and how to use AI insights as a conversation starter—not a label. Finally, I measure impact quarterly and adjust based on what actually changes behavior and outcomes.
Tool stack that keeps it simple
I aim for a connected stack: HRIS as the system of record, a people analytics layer for dashboards and modeling, talent retention software for workflows and alerts, and an LMS to support reskilling and internal moves. If tools do not share data, I fix integration before scaling.
Culture checklist that makes AI stick
Even the best model fails without culture. I look for leadership alignment on why retention matters, psychological safety so employees speak honestly, transparency about how data is used, and strong change leadership so managers feel supported, not blamed.
Measuring ROI and the funnel view
My chart idea is a funnel: data collection → clean data → risk insights → manager actions → employee outcomes → retention improvement. For ROI, I track quarterly turnover rate, regrettable loss, internal mobility, engagement shifts, and cost avoided from reduced backfills. When I can show fewer exits and faster growth moves, AI-powered retention becomes a business habit, not a one-time project.
Use AI-driven predictive analytics, smarter onboarding, flexible work options, clear career paths, and reskilling to reduce turnover — prioritize culture, measure ROI, and deploy retention tools thoughtfully.